One
of the factors that can have a great impact on corrosion severity is the
geometry of the service application. Obvious cases are those involving
crevices, seams, laps and welds where the formation of an occluded cell can
result in differences between local and bulk solutions. Other factors such as
hot wall effects can also complicate service conditions. In some cases, the
whole service condition may bring together somewhat unique combinations of
solution and geometric variables which can not be easily understood. One such
case that illustrates this situation is exhibited by corrosion under insulation
(CUI).
CUI
can result from a build-up of water and contaminants in the annular space
between the metal surface and the thermal insulation. It is compounded by
situations such as hot wall effects and alternate wetting and drying. The
problem typical of CUI is that corrosion rates are typically greater than predicted
based on aqueous corrosion data produced from either open or closed system
measurements. In an open system, corrosion rates are generally low due to the
decreasing solubility of oxygen with increasing temperature. The CUI situation
more closely represents a closed system; however, prior studies attempting to
simulate CUI by these methods have generally been unsuccessful.
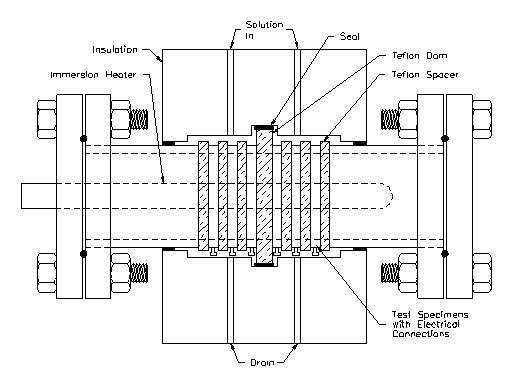
Recently,
experiments were conducted with a special test cell designed at CLI
International, Inc. to model CUI (See Figure 1). This novel approach included the use of an internally heated metal tune and isolated ring specimens surrounded by insulation material. The annular space was filled with a simulated atmospheric condensate. Corrosion was assessed using ring specimens that could be monitored using linear polarization resistance (LPR) techniqies per ASTM G59, mass loss per ASTM G1 and localized corrosion rate per ASTM G46. Tests can incorporate isothermal conditions, thermal cycling and alternate wet dry conditions
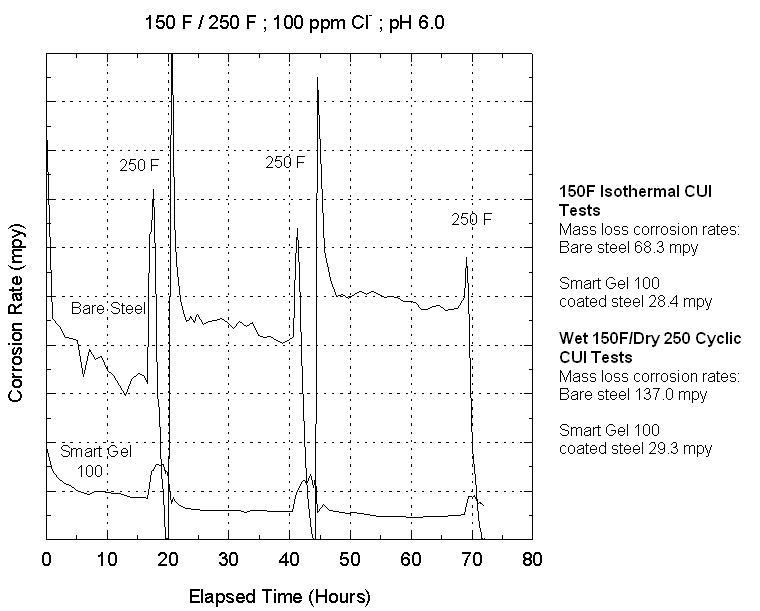
Figure
2 shows the comparison of isothermal and cyclic tests. The mass-loss corrosion
rates show values comparable to those associated with CUI in field and plant
operations. Of particular interest is the variation in corrosion rate with time
for the cyclic tests. The trend indicates that periods of maximum corrosivity
involve the periods during re-wetting of the metal surface following the dry
cycle. The peaks in corrosion rate are 2 to 3 times the steady state corrosion
rates. Furthermore, for cyclic wet-dry conditions, the steady state corrosion
rate also increases with time. The benefit of protective surface treatments
which results in much lower rates of corrosion versus time can also be seen.

Figure 1 - CUI Test Cell

Figure 2 - Instantaneous
and mass-loss corrosion rates for CUI system